- Hyland Connect
- Platform
- Alfresco
- Alfresco Blog
- Troubleshooting Alfresco Content Services Performa...
- Subscribe to RSS Feed
- Mark as New
- Mark as Read
- Bookmark
- Subscribe
- Printer Friendly Page
- Report Inappropriate Content
Troubleshooting application performance can be tricky, especially when the application in question has dependencies on other systems. Alfresco's Content Services (ACS) platform is exactly that type of application. ACS relies on a relational database, an index, a content store, and potentially several other supporting applications to provide a broad set of services related to content management. What do you do when you have a call that is slow to respond, or a page that seems to take forever to load? After several years of helping customers diagnose and fix these kinds of issues, my advice is to start at the bottom and work your way up (mostly).
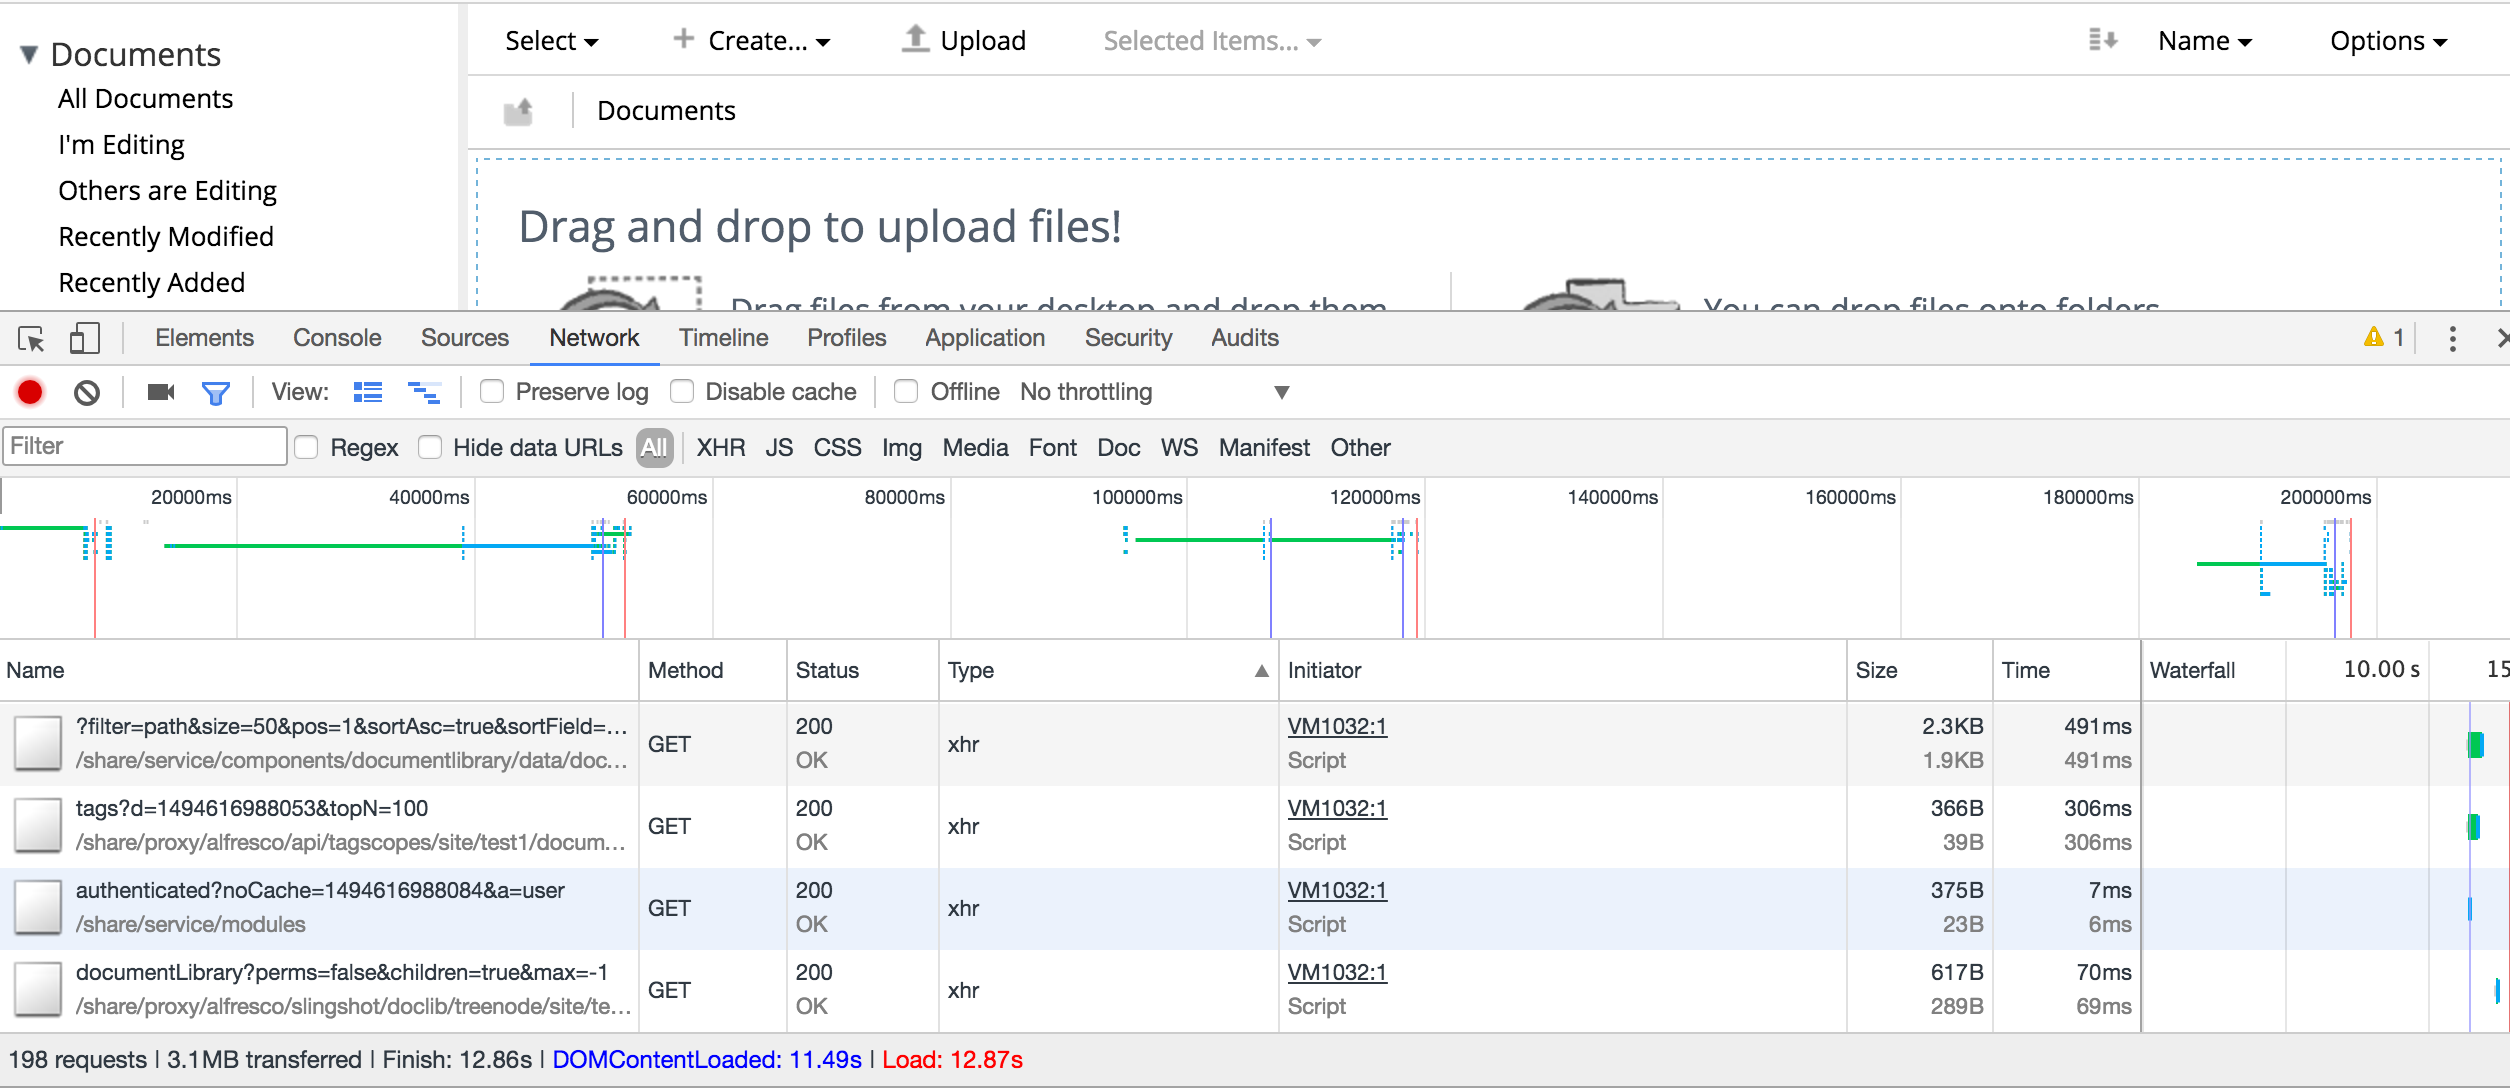
When faced with a performance issue in Alfresco Content Services, the first step is to identify exactly what calls are responding slowly. If you are using CMIS or the ACS REST API, this is simple enough, you'll know which call is running slowly and exactly how you are calling it. It's your code making the call, after all. If you are using an ADF application, Alfresco Share or a custom UI it can become a bit more involved. Identifying the exact call is straightforward and you can approach this the same way you would approach it for any web application. I usually use Chrome's built in dev tools for this purpose. Take as an example the screenshot below, which shows some of the requests captured when loading the Share Document Library on a test site:

In this panel we can see the individual XHR requests that Share uses to populate the document library view. This is the first place to look if we have a page loading slowly. Is it the document list that is taking too long to load? Is it the tag list? Is it a custom component? Once we know exactly what call is responding slowly, we can begin to get to the root of our performance issue.
When you start troubleshooting ACS performance, it pays to start at the bottom and work your way up. This usually means starting at the JVM. Take a look at your JVM stats with your profiler of choice. Do you see excessive CPU utilization? How often is garbage collection running? Is the system constantly running at or close to your maximum memory allocation? Is there enough system memory available to the operating system to support the amount that has been allocated to the JVM without swapping? It is difficult to provide "one size fits all" guidance for JVM tuning as the requirements will vary based on the the type of workload Alfresco is handling. Luis Cabaceira has provided some excellent guidance on this subject in his blog. I highly recommend his series of articles on performance, tuning and scale. When troubleshooting ACS performance, start by ensuring you see healthy JVM behavior across all of your application tiers. Avoid the temptation to just throw more memory at the problem, as this can sometimes make things worse.
Unpacking Search Performance
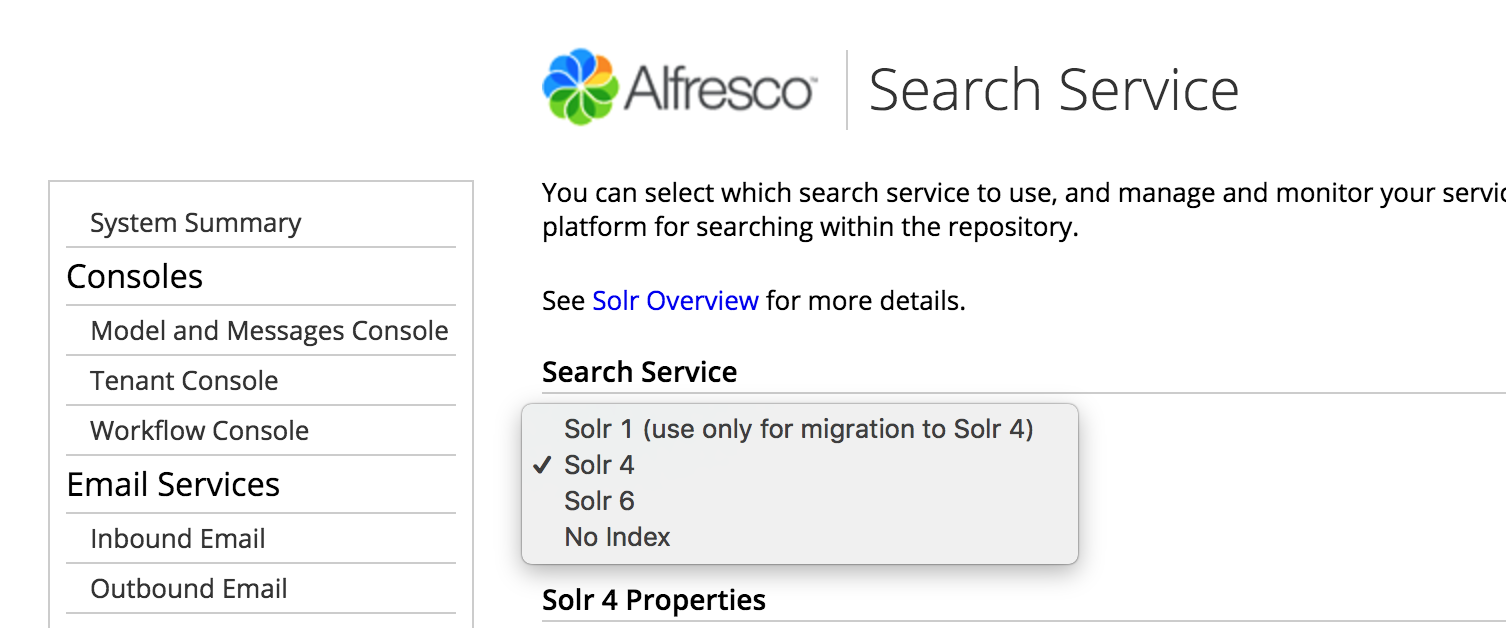
Assuming that the JVM behavior looks normal, the next step is to look at the other components on which ACS depends. There are three main subsystems that ACS uses to read / write information: The database, the index, and the content store. Before we can start troubleshooting, we need to know which one(s) are being used in the use case that is experiencing a performance problem. In order to do this, you will need to know a bit about how search is configured on your Alfresco installation. Depending on the version you have installed, Alfresco Content Services (5.2+) / Alfresco One (4.x / 5.0.x / 5.1.x) supports multiple search subsystem options and configurations. It could be Solr 1.4, Solr 4, Solr 6 or your queries could be going directly against the database. If you are on on Alfresco 4.x, your system could also be configured to use the legacy Lucene index subsystem, but that is out of scope for this guide. The easiest way to find out which index subsystem is in use is to look at the admin console. Here's a screenshot from my test 5.2 installation that shows the options:

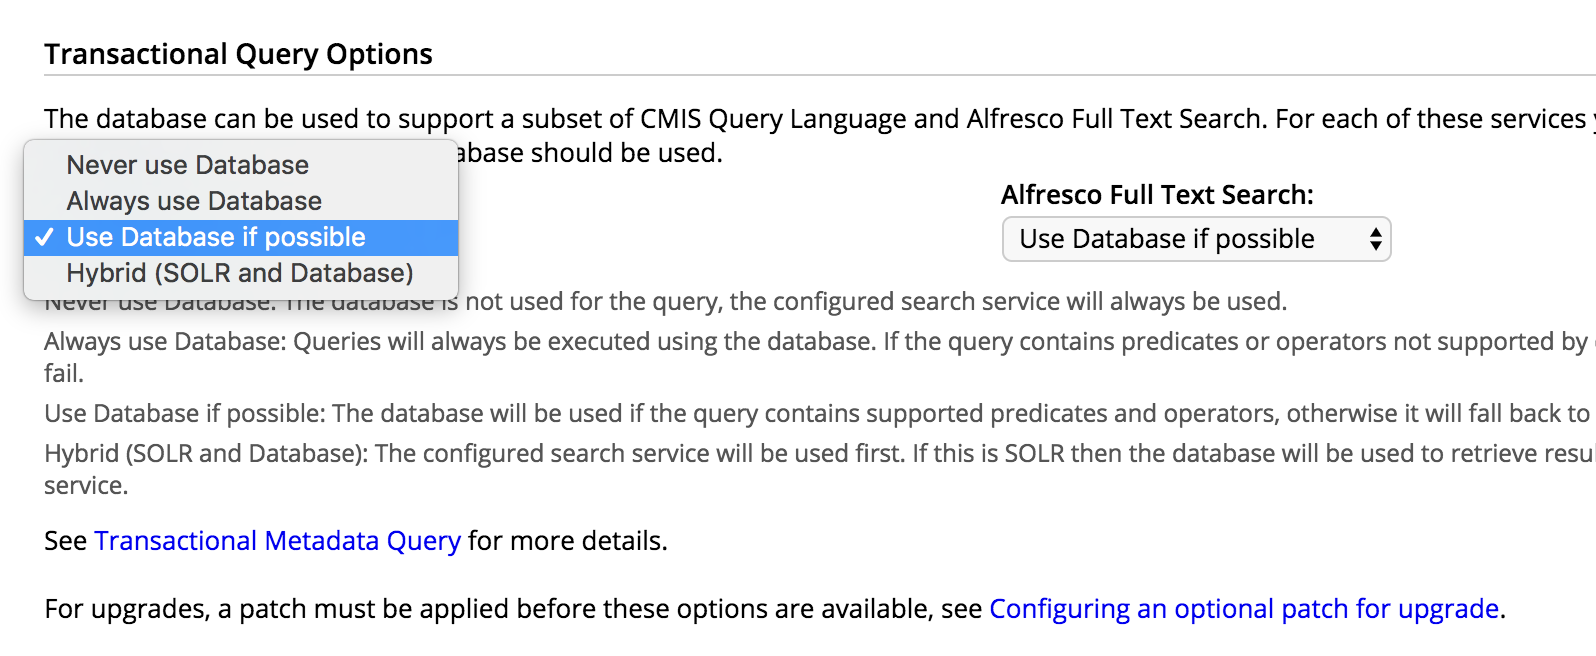
Now that we know for sure which search subsystem is configured, we need to know a little bit more about search configuration. Alfresco Content Services supports something known as Transactional Metadata Queries. This feature was added to supplement Solr for certain use cases. The way Solr and ACS are integrated is "eventually consistent". That is to say that content added to the repository is not indexed in-transaction. Instead, Solr queries the repository for change sets, and then indexes those changes. This makes the whole system more scalable and performant when compared with the older Lucene implementation, especially where large documents are concerned. The drawback to this is that content is not immediately queryable when it is added. Transactional Metadata Queries work around this by using the metadata in the database to perform certain types of queries, allowing for immediate results. When troubleshooting performance, it is important to know exactly what type of query is executed, and whether it runs against the database or the index. Transactional metadata queries can be independently turned on or off to various degrees for both Alfresco Full Text Search and CMIS. To find out how your system is configured, we can again rely on the ACS admin console:

The full scope of Transactional Metadata Queries is too broad for this guide, but everything you need to know is in the Alfresco documentation on the topic. Armed with knowledge of our search subsystem and Transactional Metadata Query configurations, we can get down to the business of troubleshooting our queries. Given a particular CMIS or AFTS query, how do we know if it is being executed against the DB or the index? If this is a component running a query you wrote, then you can look at the Transactional Metadata Query documentation to see if Alfresco would try to run it against the database. If you are troubleshooting a query baked into the product, or you want to see for sure how your own query is being executed, turn on debug logging for class DbOrIndexSwitchingQueryLanguage. This will tell you for sure exactly where the query in question is being run.
The Database
If you suspect that the cause may be a slow DB query, there are several ways to investigate. Every DB platform that Alfresco supports for production use has tools to identify slow queries. That's a good place to start, but sometimes it isn't possible to do because you, as a developer or ACS admin, don't have the right access to the DB to use those tools. If that's the case you can contact your DBA or you can look at it from the application server side. To get the app server view of your query performance you again have a few options. You could use a JDBC proxy driver like Log4JDBC or JDBCSpy that can output query timing to the logs. It seems that Log4JDBC has seen more recent development so that might be the better choice if you go the proxy driver route. Another option is to attach a profiler. JProfiler and YourKit both support probing JDBC performance. YourKit is what we use most often at Alfresco, and here's a small example of what it can show us about our database connections:

With this view it is straightforward to see what queries are taking the most time. We can also profile DB connection open / close and several other database related bits that may be of interest. The ACS schema is battle tested and performant at this point in the product lifecycle, but it is fairly common to see slow queries as a result of a database configuration problem, an overloaded shared database server, poor network connection to the database, out of date index statistics or a number of other causes. If you see a slow query show up during your analysis, you should first check the database server configuration and tuning. If you suspect a poorly optimized query (which is rare) contact Alfresco support.
One other common source of database related performance woes is the database connection pool. Alfresco recommends setting the maximum database connection pool size on each cluster node to the number of concurrent application server worker threads + 75 to cover overhead from scheduled jobs, etc. If you have Tomcat configured to allow for 200 worker threads (200 concurrent HTTP connections) then you'll need to set the database pool maximum size to 275. Note that this may also require you to increase the limit on the database side as well. If you have a lot of requests waiting on a connection from the pool that is not going to do good things for performance.
The Index
The other place where a query can run is against the ACS index. As stated earlier, the index may be one of several types and versions, depending on exactly what version of Alfresco Content Services / Alfresco One you are using and how it is configured. The good news is that you can get total query execution time the same way no matter which version of Solr your Alfresco installation is using. To see the exact query that is being run, how long it takes to execute and how many results are being returned, just turn on debug logging for class SolrQueryHttpClient. This will output debug information to the log that will tell you exactly what queries are being executed and how long each execution takes. Note that this is the query time as returned in the result set, and should just be the Solr execution time without including the round trip time to / from the server. This is an important distinction, especially where large result sets are concerned. If the connection between ACS and the search service is slow then a query may complete very quickly but the results could take a while to arrive back at the application server. In this case the index performance may be just fine, but the network performance is the bottleneck.
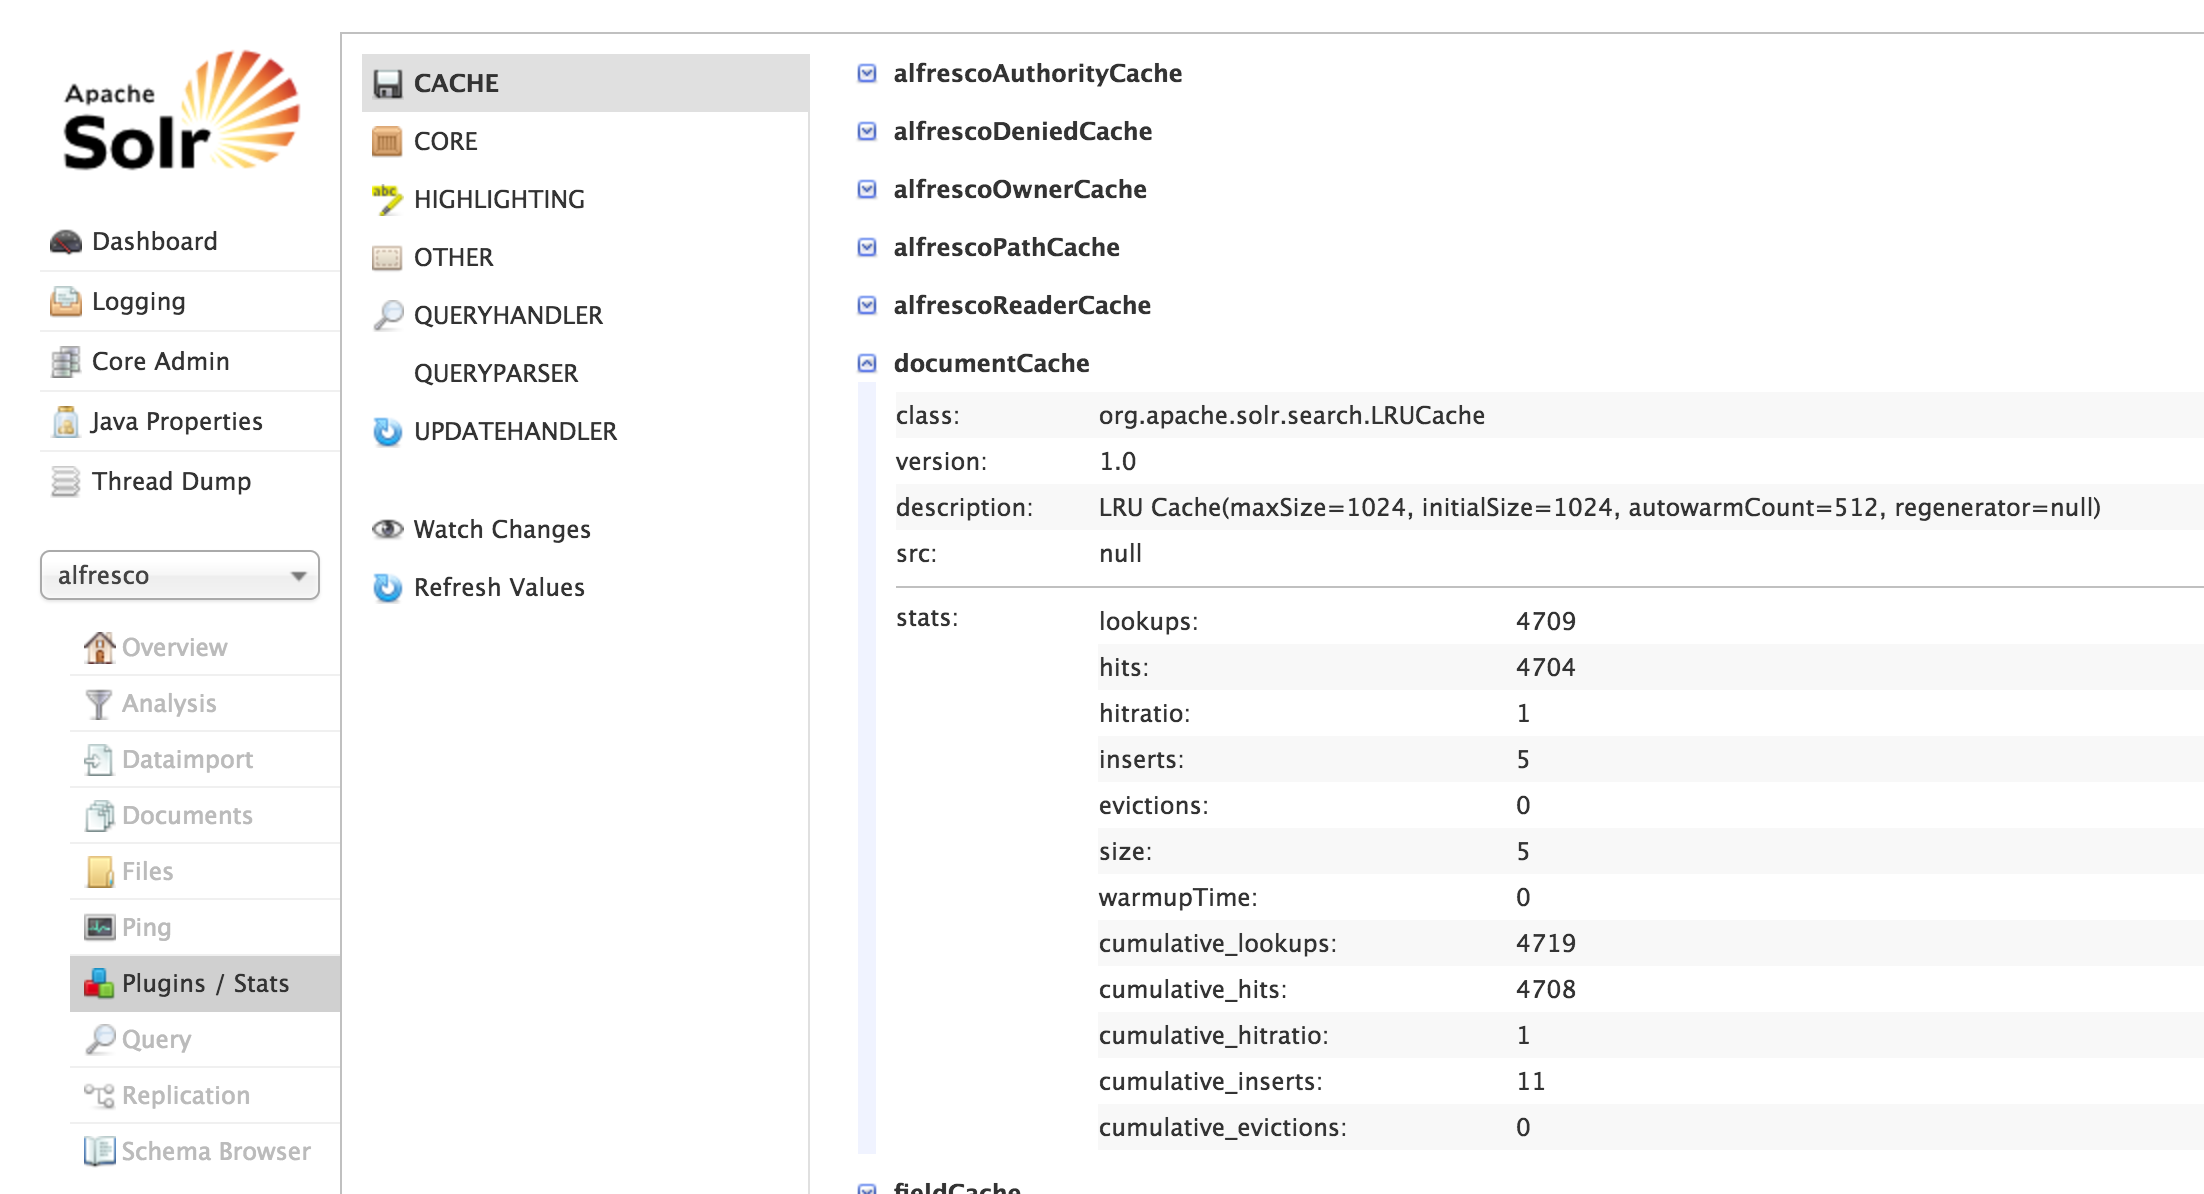
If the queries are running slowly, there are several things to check. Good Solr performance depends heavily on good underlying disk I/O performance. Alfresco has some specific recommendations for minimum disk performance. A fast connection between the index and repository tiers is essential, so make sure that any load balancers or other network hardware that sit between the tiers are providing good performance. Another thing to check is the Solr cache configuration. Alfresco's search subsystem provides a number of caches that improve search performance at the cost of additional memory. Make sure your system is sized appropriately using the guidance Alfresco provides on index memory requirements and cache sizes. Alfresco's index services and Solr can show you detailed cache statistics that you can use to better understand critical performance factors like hit rates, evictions, warm up times, etc as shown in this screenshot from Alfresco 5.2 with Solr 4:

In the case of a large repository, it might also help to take a deeper look at how sharding is configured including the number of shards and hosts and whether or not the configuration is appropriate. For example, if you are sharding by ACL and most of your documents have the same permissions, then it's possible the shards are a bit unbalanced and the majority of requests are hitting a single shard. For this case, sharding by DBID (which ensures an even distribution) might be more appropriate and yield better performance.
It is also possible that a slow running query against the index might need some tuning itself. The queries that Alfresco uses are well optimized, but if you are developing an extension and want to time your own queries I recommend looking at the Alfresco Javascript Console. This is one of the best community developed extensions out there, and it can show you execution time for a chunk of Alfresco server-side Javascript. If all that Javascript does is execute a query, you can get a good idea of your query performance and tweak / tune it accordingly.
The Content Store
Of all of the subsystems used for storing data in Alfresco, the content store is the one that has (typically) the least impact on overall system performance. The content store is only used when reading / writing content streams. This may be when a new document is uploaded, when a document is previewed, or when Solr requests a text version of a document for indexing. Poor content store performance can show itself as long upload times under load, long preview times, or long delays when Solr is indexing content for the first time. Troubleshooting this means looking at disk utilization or (if the content store resides on a remote filesystem) network utilization.
Into The Code
A full discussion of profiling running code would turn this from an article into a book, but any good systems person should know how to hook up a profiler or APM tool and look for long running calls. Many Alfresco customers use things like Appdynamics or New Relic to do just that. Splunk is also a common choice, as is the open source ELK stack. All of these suites can provide a lot more than just what a profiler can do and can save your team a ton of time and money. Alfresco's support team also finds JStack thread dumps useful. If we see a lot of blocked threads that can help narrow down the source of a problem. Regardless of the tools you choose, setting up good monitoring can help you find emerging performance problems before they become user problems.
Conclusion
This guide is nowhere near comprehensive, but it does cover off some of the most common causes for Alfresco performance issues we have seen in the support world. In the future we'll do a deeper dive into the index, repository and index tier caching, content transformer selection and execution, permission checking, governance services and other advanced topics in performance and scalability.
You must be a registered user to add a comment. If you've already registered, sign in. Otherwise, register and sign in.
- Understanding Content Indexing in Alfresco: Configuration, Architecture, and Impact on Performance in Alfresco Blog
- January 2026 - Alfresco Customer Newsletter in Alfresco Blog
- November 2025 - Alfresco Customer Newsletter in Alfresco Blog
- Alfresco Community Edition 25.3 Release Notes in Alfresco Blog
- Alfresco 6.1.2 + Solr (AFTS): Exact phrase search not working in Alfresco Forum
