- Hyland Connect
- Platform
- Alfresco
- Alfresco Blog
- Solr monitoring (using Nagios and alikes)
- Subscribe to RSS Feed
- Mark as New
- Mark as Read
- Bookmark
- Subscribe
- Printer Friendly Page
- Report Inappropriate Content
Having a broad and efficient monitoring system is key! It allows for corrective maintenance to happen asap and, if properly setup, it allows as well for pro-active maintenance.
Miguel Rodriguez already touched that topic in a very good post addressing it with ELK
Here I'll focus on a different solution and scope.
Within Alfresco Content Service, one of the component which is often the poor cousin of monitoring is Solr. In best case scenarios solr http interface is monitored with its Heap usage. Yet, it does need a lot of care in order to make sure it works efficiently. Enhancing monitoring of this component will make you detect problems sooner and fix it before it impacts users. It will also help you drawing a picture of how your search service evolves: Is it becoming slower than before? Is the number of segments increasing to a critical point? Are the index getting bigger for some reasons? And last but not least, having a deeper monitoring helps you in capacity planning tasks!
Here I'll explain why I wrote this little check for Solr and how to use it.
Choosing the monitoring system
As explained earlier there are already some materials regarding monitoring Alfresco with ELK, so there was no use re-inventing the wheel. However some of the things monitored here are not in the ELK setup described above, so I could have enrich the ELK project...
But at the root of this plugin is a customer request. That customer wanted to know when Solr is missing some content while indexing. He also wanted to receive alerts for that kind of events (which is not the primary role of an ELK stack). And more importantly, that customer was using an opensource monitoring system called Centreon. This solution is compatible with (and originally derived from) Nagios plugins system. That plugin system is a kind of de-facto standard with some specifications (Development Guidelines · Nagios Plugins) and many monitoring solutions supports Nagios plugins. As a consequence it made sense to work on such a plugin as I hope it can benefit to some others people.
Nagios plugins offer a wide range of probes (jmx, http, disk space, heap space, ...), some of which can be used out-of-the-box to monitor Alfresco Content Service and even provide basic checks for Solr. I won't focuse on those plugins as the goal here is to bring more monitoring capabilities than what already exists.
Those plugin provide two features:
- Alerts: event triggered based on defined thresholds
- Performance data: metrics used to generate graphs
In this blog post I'll be showing how it all works with Centreon, as it supports both features, but any other system support Nagios checks should work in a similar way.
Plugin Installation
I assume the monitoring system is already up and running and won't present how to set it up (remember it should work with any system supporting Nagios checks).
Prerequisites
The system must have python 2.7 or higher (should work with python3) and appropriate python libraries.
This plugin uses a library for Nagios plugins called nagiosplugin and urllib3 which both need to be installed.
On Debian-like systems the following should work:
$ sudo apt install python-nagiosplugin python-urllib3
Use python3-urllib3 & python3-nagiosplugin for systems using by default python3.
Otherwise simply install it with pip
$ sudo pip install nagiosplugin
$ sudo pip install urllib3
Plugin deployment
The plugin is available here on github. You can clone the repo or just download the python file check_alfresco_solr.py. Then simply copy the file to the nagios plugin directory, usually something like /usr/lib/nagios/plugins and set the execution rights.
$ sudo cp check_alfresco_solr.py /usr/lib/nagios/plugins && sudo chmod +x /usr/lib/nagios/plugins/check_alfresco_solr.py
Setting up Monitoring
First of all Id' like to explain a little deeper what the plugin does so we better understand what kind of metrics we're tracking here.
Quick description
The monitoring plugin uses information gathered from the Solr status page and the Solr summary page. Both are relatively lightweight and querying them on a regular basis should not impact performance to a noticeable point.
Among the information we gather and monitor some are documented in existing Alfresco documentation. You can find out more reading the Unindexed Solr Transactions | Alfresco Documentation
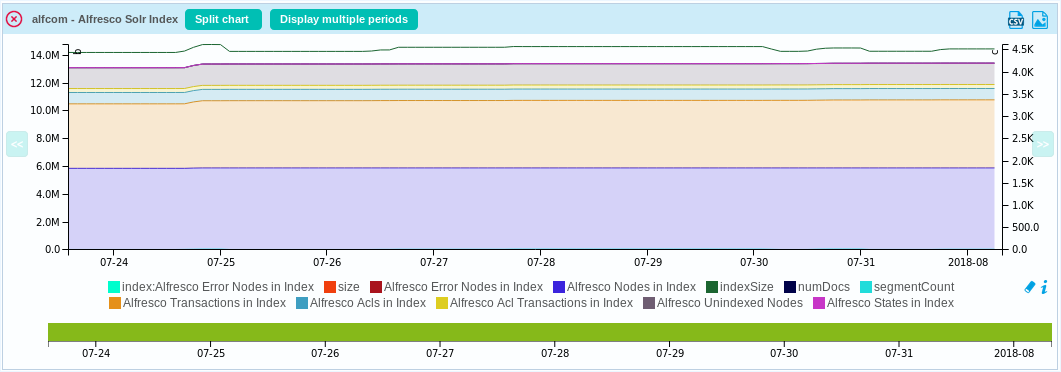
In addition to that, the plugin returns the total size of the index core, its number of documents and its number of segments.
Any of those metrics can trigger an alert and all of them are producing performance data.
Some others are not that well documented but are still important.
In the summary page Solr exposes data regarding caches. We know caches are very important for Solr to perform well. Undersize your caches and your search will be slow like an old dog. Oversize them and you may end up consuming way more expensive memory than you actually need.
Cache sizes are used in the overall memory requirement calculation for Solr. See Alfresco documentation bellow:
Calculate the memory needed for Solr nodes | Alfresco Documentation
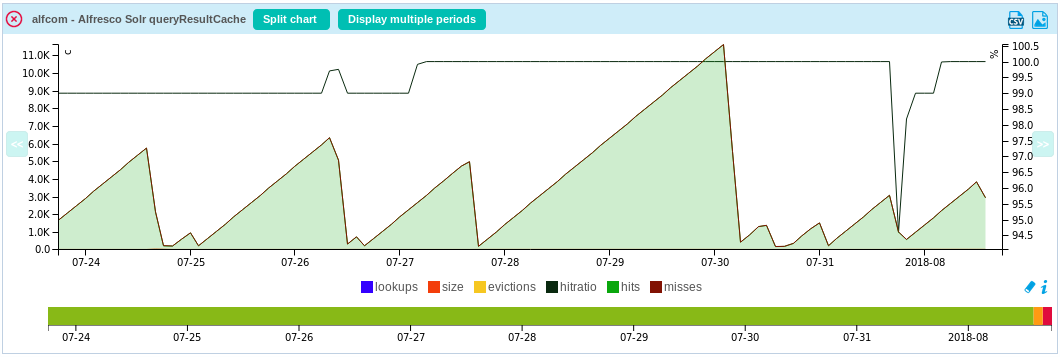
The plugin will report data on cache usage such as:
- number of lookups (incremental counter rested periodically)
- cache size (number of item in the cache)
- evictions (accumulated evictions from the cache since server startup)
- hitratio (accumulated ratio of hits vs misses)
The plugin will return warning or critical alerts based on thresholds passed as arguments. Those thresholds are applied on the hitratio only. It means you can track and graph those metrics but only hitratio can trigger alerts (eg an email or text message depending on the monitoring system configuration.)
There is number of caches in cluded in the Solr summary pages which are:
- /alfrescoPathCache: a cache used to speedup path queries (Alfresco specific cahe)
- /alfrescoAuthorityCache: a cache used to compute permissions on search results (Alfresco specific)
- /queryResultCache: a generic Solr cache to store ordered sets of document IDs
- /filterCache: a generic Solr cache to store unordered sets of document IDs
Handler data is also provided by Solr summary page. Handlers are HTTP endpoints Solr uses to handle requests... hence the name. Data provided for the handlers and used by the plugin are:
- errors: number of queries which caused an error (500 http status code)
- timeouts: number of queries which could not ne fullfilled before timeout
- requests: overall number of requests
- avgTimePerRequest: Average time to fullfill a request
- 75thPcRequestTime: maximum time it takes to reply to the 75% of the fastest requests
- 99thPcRequestTime: maximum time it takes to reply to the 99% of the fastest requests
Request time data are typically useful in order to track how the search service evolves and anticipate when scaling is needed or if something is running abnormally (e.g. slower disk access, or network latency). avgTimePerRequest is used to trigger alerts while percentile request times are only used for performance data.
A handler returning an error count higher than zero will always trigger a critical alert, and one returning a timeout will always trigger a warning alert.
While they are not really a problem (from an operation point of view), syntaxically incorrect searches will increment the error counter and thus generate critical alerts. It can be useful to have such alerts to track improper use of the API or suspicious behaviours. However having alerts for this kind of events may not be appropriate in some environments so this can be changed using a command line option (`--relaxed`), in which case only time based alerts will be triggered using the threshold provided as parameters.
There are three handlers exposed by Solr in the summary page, all three can be monitored:
- /alfresco
- /afts
- /cmis
Plugin configuration
Now that we understand what the plugin can monitor, and it is deployed on the Centreon (Nagios or similar) server, let's take a look of what we need to do to set monitoring up.
In Centreon most configuration is done through a web interface, so first of all we'll login to the web UI as admin. In Nagios, same configuration applies but editing configuration files has to be done using a good old text editor (all configuration files should be located in /etc/nagios).
Check commands
With Nagios like system it all begins with a new command to add to the system. When deploying the plugin we've copied it to the Nagios plugin directory (by default /usr/lib/nagios/plugins). In Centreon most configuration is done through a web interface and the plugin directory is referred to as $CENTREONPLUGINS$. On Nagios similar configuration applies but editing configuration files has to be done through a regular text editor (all configuration files should be located in /etc/nagios).
So in the "Configuration\Commands\Checks" menu click the "Add" button to add a new command and set it as shown bellow:
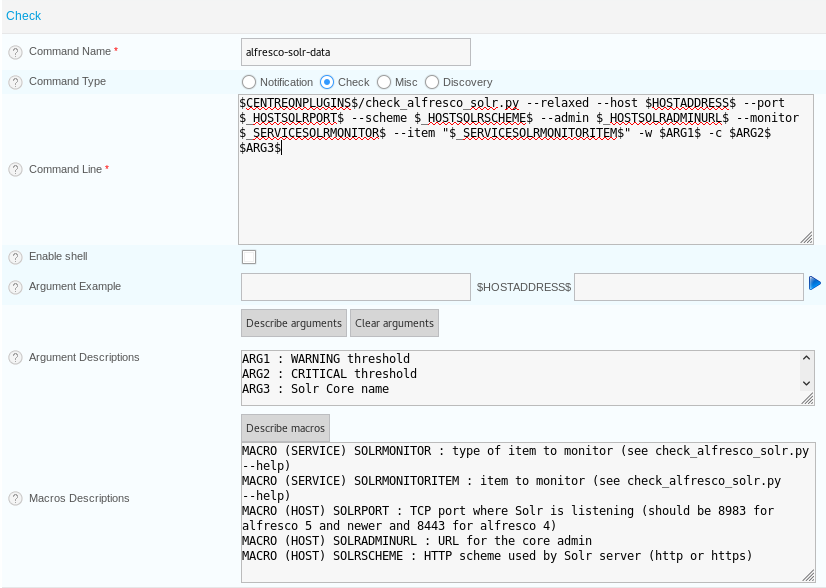
the command can be explained as follow:
- --relaxed: do not trigger alerts if handlers reports errors or timeouts
- --host $HOSTADDRESS$: specify the Solr hostname (will be expanded from the Solr server configuration)
- --port $_HOSTSOLRPORT$: specify the Solr port (will be expanded from the service template)
- --scheme $_HOSTSOLRSCHEME$: specify the Solr http scheme (will be expanded from the service template)
- --admin $_HOSTSOLRADMINURL$: specify the Solr admin URL (will be expanded from the service template)
- --monitor $_SERVICESOLRMONITOR$: specify the kind of element we want to monitor (handlers or caches or index values)
- --item "$_SERVICESOLRMONITORITEM$": specify the name of the item we monitor
- -w $ARG1$: the warning threshold triggering the warning alerts (value depends on what we want to monitor
- -c $ARG2$: the critical threshold triggering the critical alerts (value depends on what we want to monitor
- $ARG3$: the name of the Solr core to monitor (will be expanded from the service template.
Service templates
Each item we want monitor will be defined as a service attached to a host. In the end, we will need to attach one service per solr host, per core, per cache and/or handler, per index metrics we want to monitor.
This can lead to numerous services and can be long to configure. For this reason it is not desirable to trigger alters for every single metric we have access to. For example triggering alerts for "Alfresco Nodes in Index" doesn't make much sense while "Alfresco Error Nodes in Index" does.
Nagios provides inheritance and template features, this is also very handy to avoid duplicating configuration for each service. To be concrete, it means we can define a service using a template which inherits values from each other. For instance, in order to define a service to monitor the "/queryresultCache" cache, we can define a general template for caches (e.g. setting $SOLRMONITOR$ , solr core name together with the warning and critical thresholds), and a more specific template for the "/queryresultCache" (setting the $SOLRMONITORITEM$) which inherit from the general one.
Below I explain how to setup the Solr "/queryResultCache". For a broader monitoring you should also set more service and service templates for the needed items. See the help message of the plugin by using (or see documentation on the git repo):
$ python check_alfresco_solr.py --help
So in the admin, let's go to the "Configuration\Services\Templates" section and create a first template called "alfresco-solr-caches":
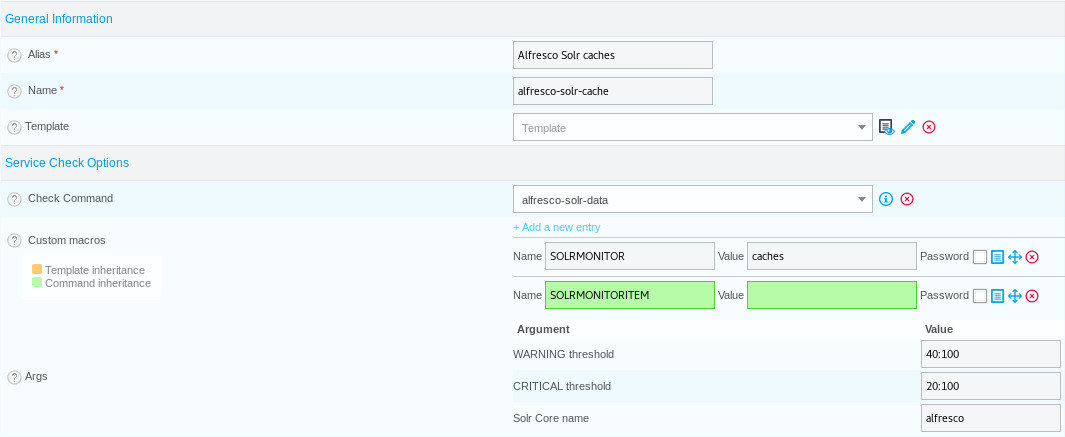
- Warning threshold is set so that a hitratio lower than 40% will trigger a warning alert
- Critical threshold is set so that a hitratio lower than 20% will trigger a critical alert
Then we create a second, more specific, template called "alfresc-solr-queryResultCache" which inherits from the general one:
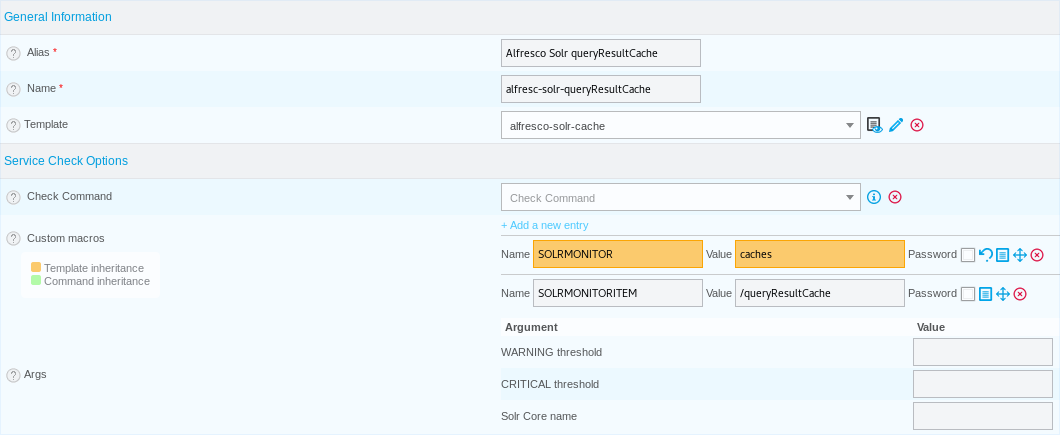
Here we just set the specific cache we want to monitor. Also note the "Template" field which reference the general template. Due to the template inheritance we can leave other fields blank and inherit values.
Host Template
Just like we created service templates, we will create a host template. This is to avoid manually attaching the service templates we created to each individual Solr server we want to monitor.
In the Centreon admin navigate to "Configuration\Host\Template" and create a new template called "alfresco-solr" (for instance). Then go in the "Relations" tab of this host and add the service templates we defined earlier and are relevant for you:
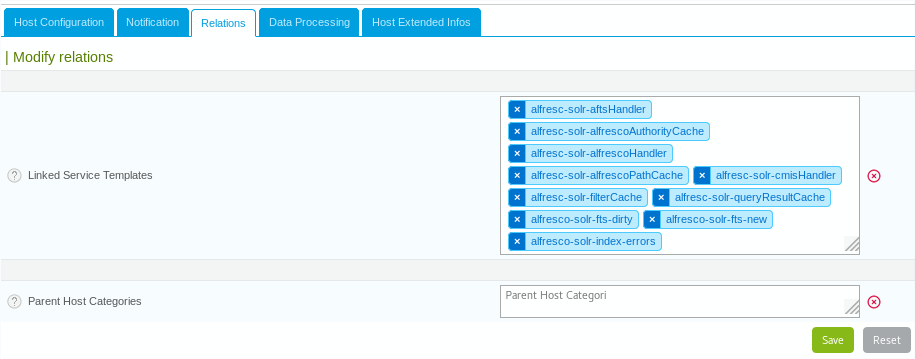
Click Save.
At this point we can define the host and monitoring will be ready. Either you can create a new host (if it doesn't exist already) or you can just apply the newly defined host template to an existing host.
Doing so will add Solr specific macros you will need to fill when to validate the host:

As an example bellow is the monitoring service page of a solr host:

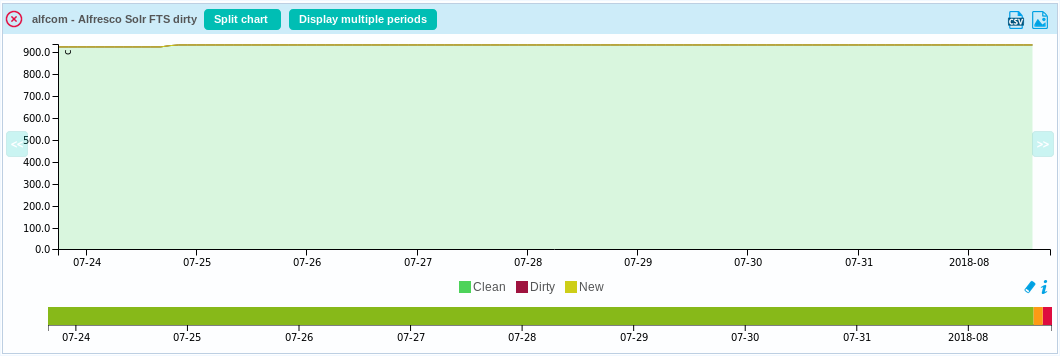
And here the graph you can expect:
For index:
For FTS:
For a cache:
For a handler:

Of course monitoring doesn't fix anything by itself. It requires thoughtful configuration (to match your instance workload) and to be watched carefully by admins who know what to do in case of alerts.
For example in case your monitoring system reports "Alfresco Error Nodes in Index" your first action will probably be to trigger a "FIX" action in Solr admin console.
For general Solr troubleshooting please refer to the Alfresco documentation here.
You must be a registered user to add a comment. If you've already registered, sign in. Otherwise, register and sign in.
